Bullish vs Bearish: What These Crypto & Forex Signals Really Mean
When traders talk about ‘bullish’ and ‘bearish’ in crypto or forex, they are describing market direction and investor sentiment. Understanding terms like bullish flag crypto, bearish flag, bearish divergence, and bearish candlestick helps investors make smarter decisions.
This article explains all of these terms in simple language.
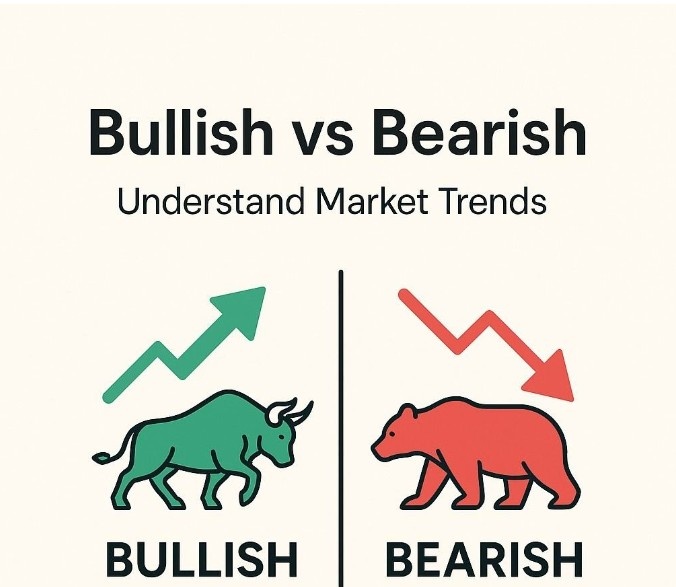
✅ What Does ‘Bullish’ Mean in Crypto?
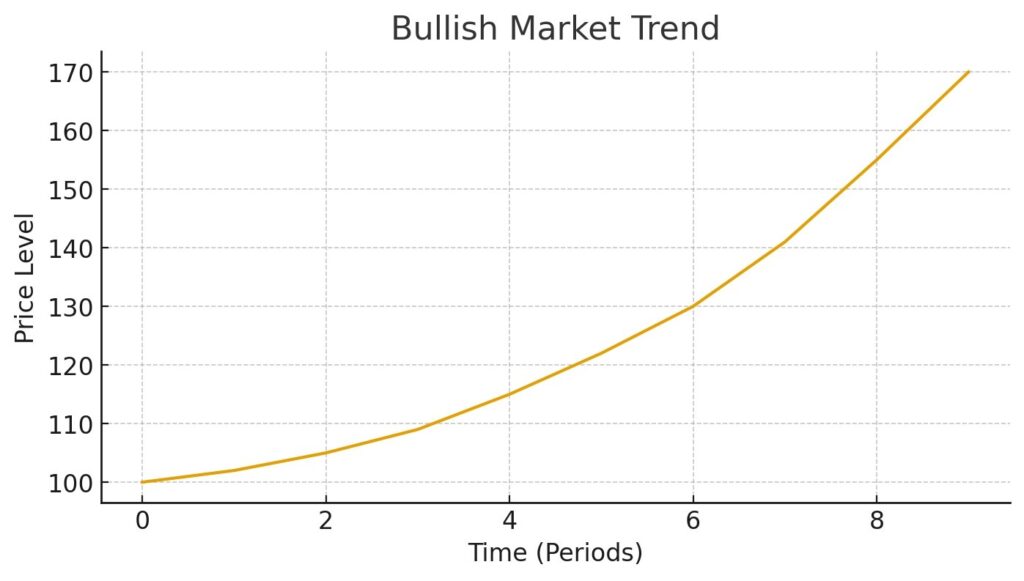
In crypto trading, ‘bullish’ means investors believe prices will rise.
A bullish market reflects optimism — buyers are in control and pushing prices higher.
Example:
If Bitcoin starts moving up consistently and traders expect more upside, the market is considered bullish.
Many investment groups use the term — for example, a company named Crypto Bullish Investment LLC would suggest it focuses on investments expecting future growth.
✅ What Does ‘Bearish’ Mean in Crypto?
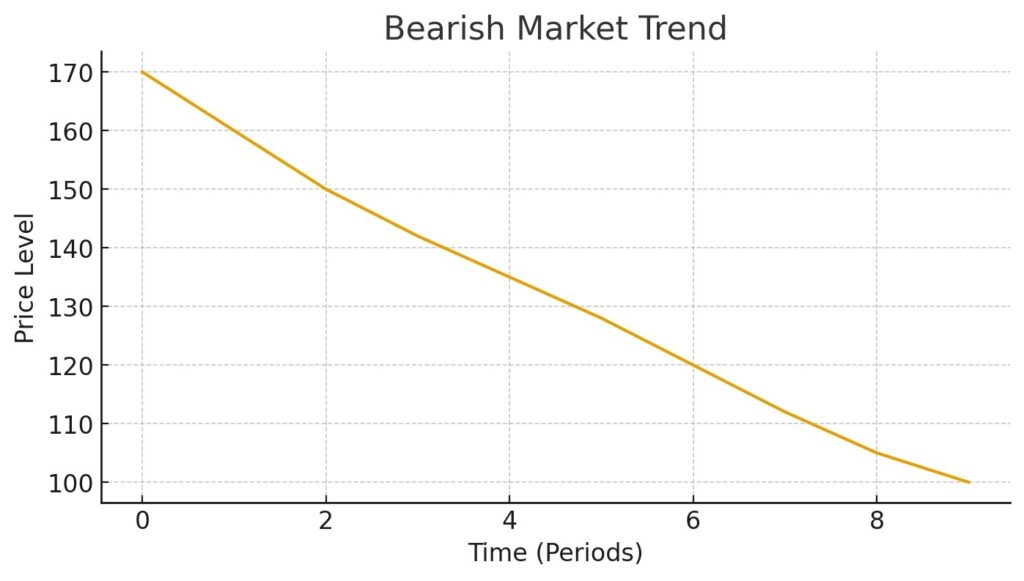
A bearish market means traders expect prices to fall.
Selling pressure is stronger than buying, and prices trend downward.
Bearish sentiment can last days, weeks, or even months depending on market psychology and global events.
📉 Bearish Candlestick (Definition)
A bearish candlestick is a candle on the chart showing downward price movement.
It typically opens high and closes lower, signalling selling pressure.
Bearish candles indicate:
- Decline in price
- Strong seller dominance
- Possible trend reversal from bullish to bearish
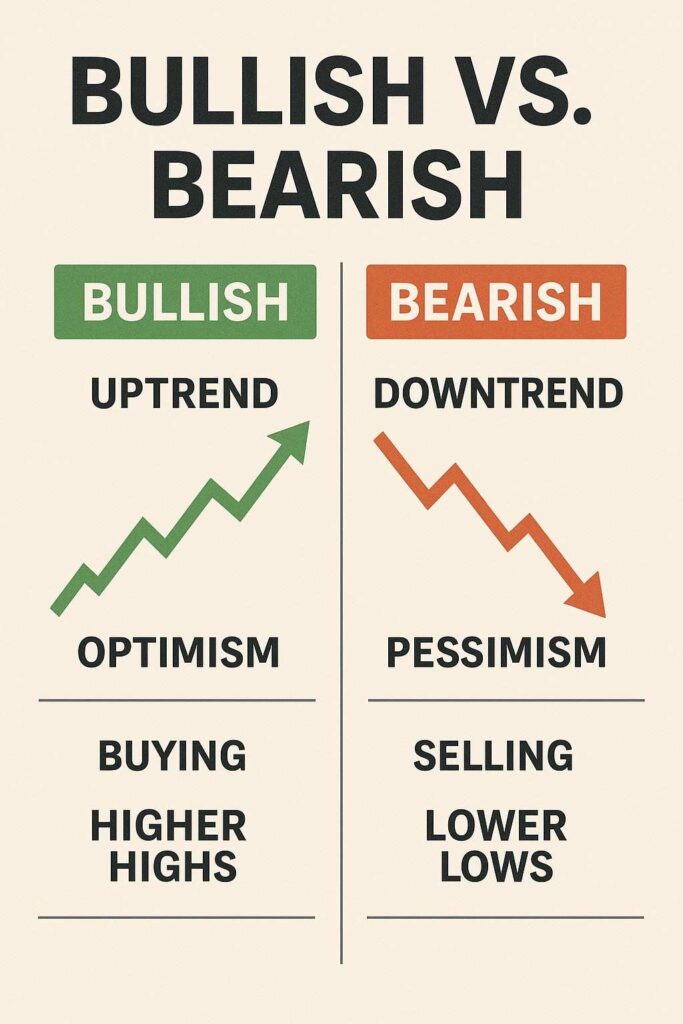
🟢 Bullish vs. Bearish (Simple Comparison)
| Feature | Bullish | Bearish |
|---|---|---|
| Price Trend | Going up | Going down |
| Sentiment | Optimistic / growth | Fear / decline |
| Traders’ Behaviour | Buying | Selling |
| Trend Goal | Higher highs | Lower lows |
📈 Bullish Flag Crypto (Bullish Continuation Pattern)
A bullish flag is a chart pattern that shows a small pullback before the price continues upward.
It has two parts:
- Flagpole – strong upward movement
- Flag – short sideways or downward channel
A breakout above the flag confirms bullish continuation.
This is popular in crypto, forex, and stocks because it signals trend strength, not weakness.
📉 Bearish Flag (Bearish Continuation Pattern)
A bearish flag is the opposite.
It forms during a downtrend and shows a short pause before the price continues falling.
It has:
- Flagpole – strong drop
- Flag – sideways consolidation
A breakout below the lower trendline continues the bearish trend.
⚠️ Bearish Flag Pattern (Why It Matters)
The bearish flag pattern warns traders that the downward trend is NOT over yet.
Traders use this pattern to:
- Confirm continuation of selling trend
- Set short-selling positions.
- Avoid entering long (buy) trades too early.
⚠️ What Is Bearish Divergence?
Bearish divergence occurs when the price makes higher highs, but an indicator (like RSI) makes lower highs.
This means:
➡️ Price appears strong.
BUT
➡️ Momentum is weakening.
It’s a warning that the bullish trend may reverse into a bearish one.
🔁 When Does a Bearish Market Become Bullish in Forex?
In forex, a bearish market becomes bullish when buyers regain control, causing trend reversal.
Signals of a reversal include:
- Higher highs and higher lows forming on the chart
- Price breaking above a key resistance level
- Strong bullish candlesticks replacing bearish ones
- Increasing trading volume during upward price movement
Many traders rely on candlestick patterns, divergence signals, and breakouts to identify this shift.
🐂 Bullish vs Bearish Pattern (Trend Battle Explained)
A bullish pattern shows strength and suggests price will move up.
Examples: bullish flag, double bottom, ascending triangle.
A bearish pattern suggests price will drop.
Examples: bearish flag pattern, head & shoulders, bearish divergence.
Understanding both helps traders decide:
- When to enter a trade
- When to exit a trade
- When to avoid trades